Data-Driven HR
Some information in advance
- Foreword
As we put the finishing touches on the newest version of this book—the first to appear in English—the first edition from 2015 is already four years behind us. As we anticipated at the time, interest in and enthusiasm for the HR analytics and data-driven HR will only continue to rise worldwide.
An interview about HR analytics brought us together in the spring of 2013. When the interview was over, we continued chatting about the subject. We were in agreement that there was a lack of clarity as to what HR analytics actually encompasses and how HR can use it to make policy formation and the implementation of HR tools more data-driven. We got down to work in the autumn of 2013, and by February 2015 we had a complete manuscript. In the intervening year and a half, we learned a lot about the subject, about each other, and about the people named below. They made the first Dutch-language book about HR analytics possible.
In the years following the publication of the first edition, we have seen more and more companies, institutions, and governments discovering the potential of data analysis and ever more colleges and universities expanding their educational programs with subjects such as data-driven HR, HR analytics, and HR metrics. This has a broader context: society is learning that data technology now touches every aspect of our lives. This offers opportunities but also poses challenges and risks, such as in the fields of data security and personal data protection. Both are a precondition for being able to apply the full extent of data-driven HR and make the most of it. Organizations and everyone who works in them—management, leadership, and employees—need insight into how data technologies work and how to best use them.
To do justice to recent developments and changing regulatory environments, especially in the area of privacy, we have updated, augmented, and refined the book; we have also had it translated in response to the regular requests we have received from colleges, universities, and HR managers at multinationals to publish the book in English. We trust that this English edition will continue to help everyone who wants to understand all aspects of data-driven HR for years to come and serve as a guide and go-to reference for work and study.
Many people were involved in creating both the Dutch and English versions of this book. In particular, we would like to thank Gerard Evers, former professor of human capital valuation at Tilburg University; Tiny Beks, lecturer in human resource management at Avans Hogeschool; Mark de Lat, director of consultancy Randstad Nederland; Michiel van Asbeck, director of RaymakersvdBruggen; Jelle Dijkstra, professor of applied science; privacy lawyer Sergej Katus and computer science and privacy consultant Koen Versmissen, partners at Privacy Management Partners; data scientist Jilske Hupkes from AnalitiQs; and editor and translator Bill Nagel for their contributions.
In the interests of fairness, we should also note that as co-authors, we did not spare each other our criticism. We bombarded each other constantly with difficult questions, and if one of us didn’t agree with a passage, illustration, or even a particular word, we discussed it until we came to an alternative that worked for both of us.
Others whom we want to thank for their advice, criticisms, and valuable suggestions include MindCampus, the first publisher of the book; Patrick Coolen, manager of HR analytics at ABN AMRO; Rolf Baarda, director of Bureau Baarda; Jan Cees Marijt, VP of Group Compensation & Benefits at Sandvik; Maarten van Riemsdijk, lecturer in strategic HRM at Saxion; Jeroen Terstegge, partner at Privacy Management Partners; Karin Sanders, professor of organizational behavior and HRM at the University of New South Wales (Australia) Business School; Frank Verbeeten, professor of accounting at Utrecht University; Geert-Jan Waasdorp, director of the Intelligence Group; Diederik Gallas, director of Gids in Bedrijf; Peter van den Hout; Jancees van Westering, management coach; and Barry Condon, head of IT at Cedar. They all helped make this book possible.
Toine Al and Irma Doze
Amsterdam, September 2019
- Note to the reader
This book is for anyone who is interested in understanding the advantages of data-driven HR policy and applying data analytics and related disciplines within their own organization and HR practice. Data-driven HR has advantages for all types of commercial, noncommercial, and government organizations. The book has been written with a number of audiences in mind:
- HR managers and directors who want to gain insight into the topic and discover how they can use it in their organization
- HR business partners who want to broaden their knowledge and skills and work on an equal footing with HR analysts
- Current and future HR analysts who want to get their hands on the methods and techniques of HR data analysis
- HR consultants, business analysts, controllers, and line managers who want to deepen their knowledge of the subject and make use of the opportunities presented by HR analytics to help them do their work
HR analytics combines knowledge from a variety of disciplines, including HR management, labor and organizational psychology, IT, statistics, data analytics, marketing, planning, and strategy. The book contains many examples illustrating this. Depending on your interests, function, role, background, and information needs, you may find some chapters more relevant and useful than others. Depending on your existing knowledge and experience, you may want to skip some chapters at first and return to them later. Other chapters are indispensable to forming a good picture of the essence of the methodology and techniques. To make this process easier right from the beginning, we’ve summarized the various parts of the book and indicated which functions or roles they are most appropriate for.
Part I: Introduction
What is HR analytics and how does it improve existing HR practice?
The three chapters in Part I explain what we mean by HR analytics; how data-driven HR policy improves decision-making; how it seamlessly connects with existing methods of making HR measurable and plannable; and how it can strengthen current HR practices.
Chapter 1 describes the development of the concept of data analysis since the 1980s; the steady growth in applying data analysis to improve HR instruments and processes since 2005; and the opportunities that big data and modern communications technologies present.
Chapter 2 addresses the question of why HR should make use of analytics and data-driven decision-making. This chapter goes deeper into the shortcomings and disadvantages of traditional decision-making methods, which are primarily based on knowledge, experience, and personal judgement. Among other topics, we call attention to new insights from psychology that shed light upon the (irrational) manner in which people weigh options and make choices.
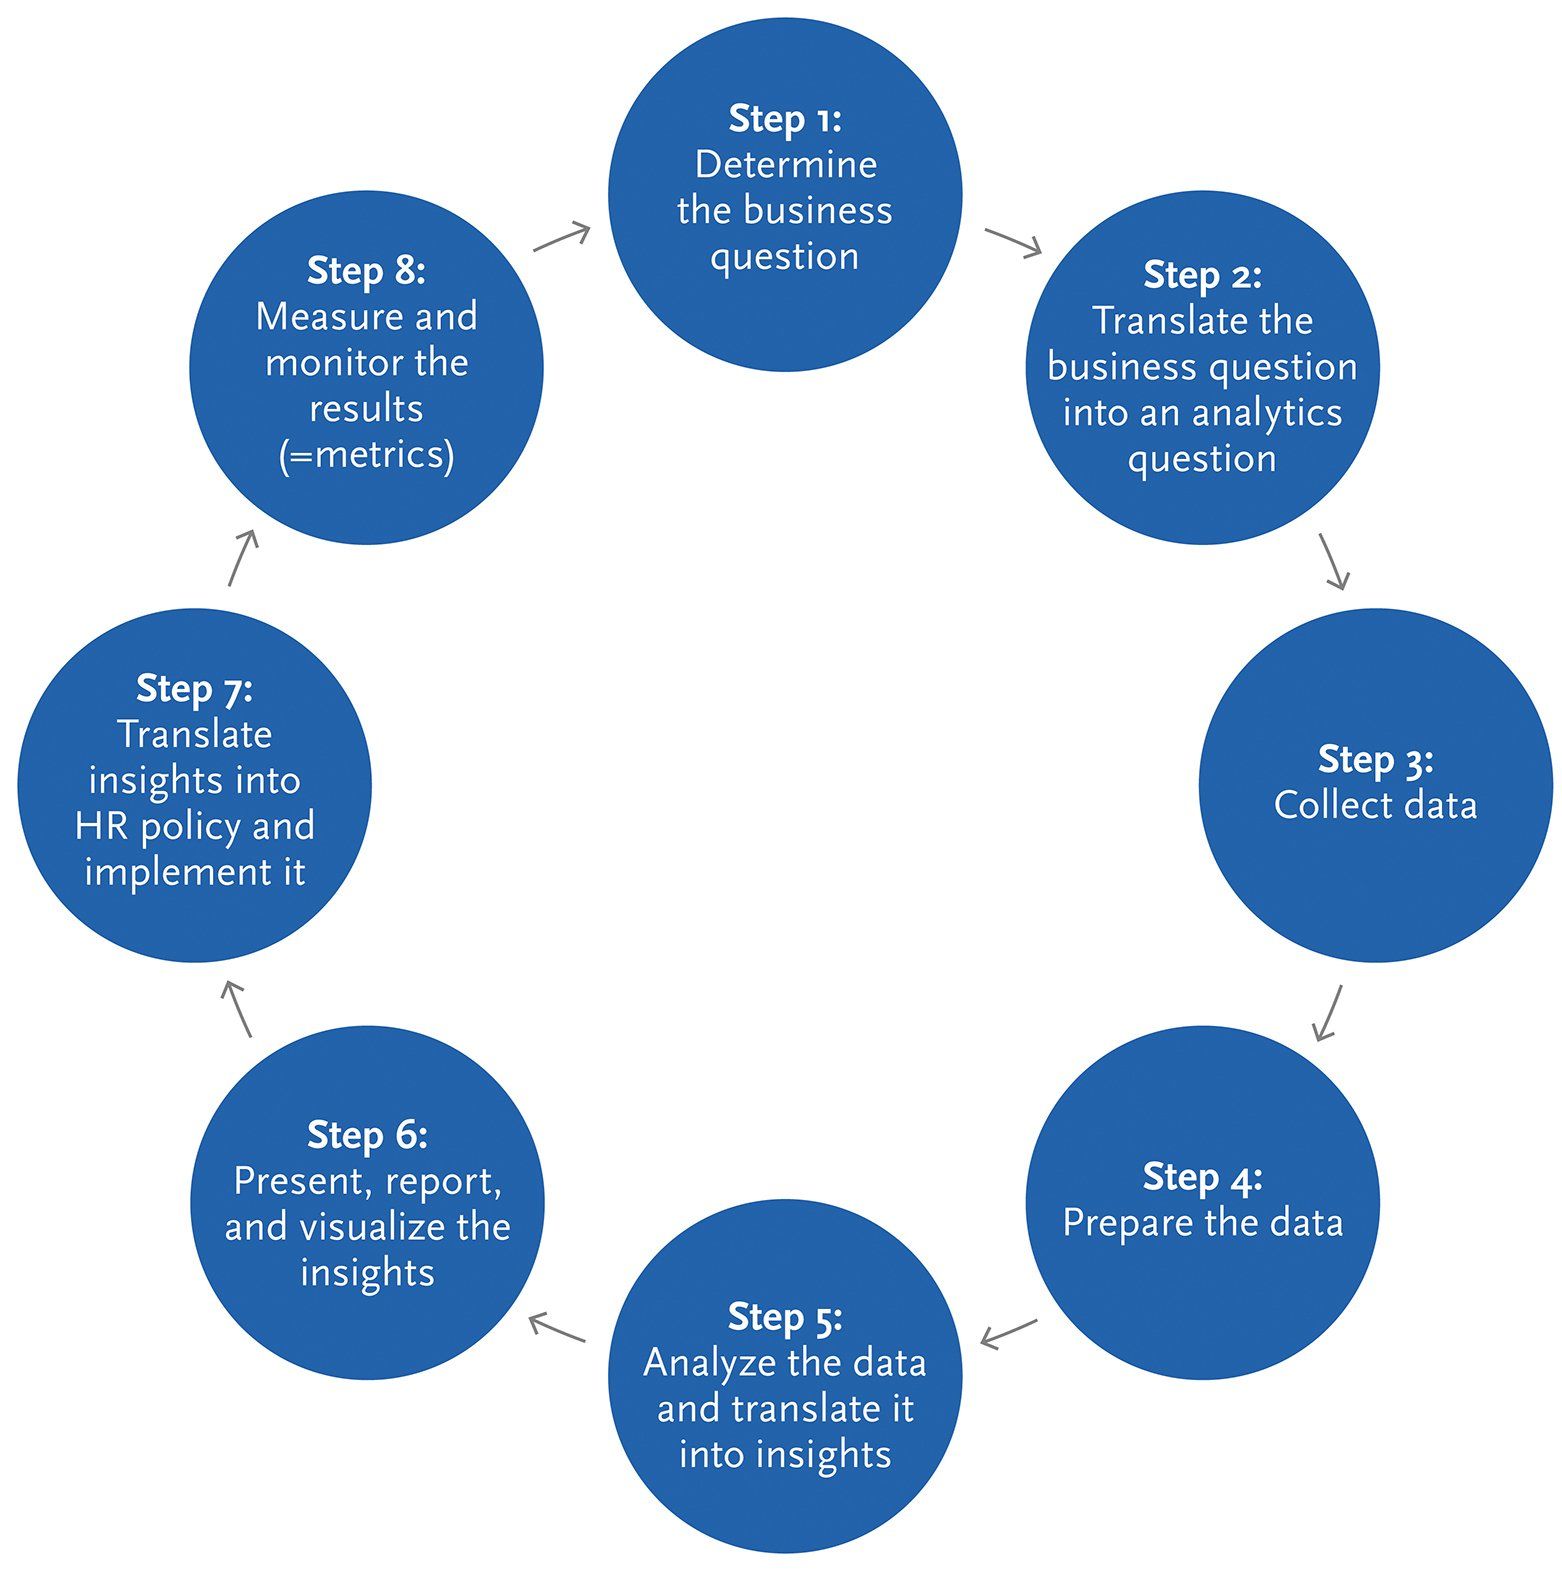
Chapter 3 goes into more detail about how to make HR measurable, including measurement methods that have been developed since the 1960s, and what possibilities data analysis and predictive models add to this. This chapter treats HR analytics as a part of business intelligence. It also introduces the data-driven HR policy life cycle, which has eight phases and includes HR analytics.
Part II: Methodology
How are each of the eight steps of an HR analytics project carried out?
The eight chapters in Part II show how to make practical use of the eight steps of the data-driven (HR) policy life cycle and describe all of the statistical methods and techniques associated with it. Part II is a bit more technical than Parts I and III and is specifically aimed at HR analysts and HR business partners.
Chapters 4, 10, and 11 are primarily intended for HR business partners; Chapters 6, 7, and 8 are aimed at HR analysts; Chapters 5 and 9 are for both roles.
Part II proceeds to the process of defining the right business questions; translating these questions into one or more analytics questions; collecting and preparing the necessary data; applying various methods of data and statistical analysis; and translating the results and conclusions obtained into reports and visualizations.
We then explain what specific HR initiatives, processes, policies, and strategies the insights you discover can lead to and how to monitor these post-implementation using metrics. Visualization plays an important role here, in the form of writing reports and configuring dashboards.
Part III: Implementation
Implementing HR analytics functionality that fits the organization
The three chapters in Part III describe how HR management can organize and implement HR analytics and the data driven policy life cycle.
Chapter 12 explains which competencies and IT facilities you need for this; how to manage data carefully; what you need to further build out the HR analytics functionality on various levels; and how to adapt the level to the needs and ambitions of the organization.
Chapter 13 takes an extensive look at privacy regulations, how to apply HR analytics according to the rules, and how to take a sensible approach to privacy. This gets a lot of attention in society, and organizations must take the sensitivities of people both inside and outside of the organization on the topic of privacy into account. This chapter explains how to process the personal data that feeds HR analytics without running into problems.
To bring the book to completion, Chapter 14 provides a checklist to determine what level your organization is at and what it needs to begin with the first HR analytics project.
Guide for the reader
Wherever possible, we provide examples and illustrations of the models discussed in the book. These are often based upon existing materials and have been adapted for the purposes of this book. The original sources for each of these are noted in footnotes and the bibliography.
- Pricing
Recommended retail price: 42,50 euro (including VAT, excluding shipping costs. Prices may vary per country and per retailer.
Part I - Introduction
- Chapter 1 What is HR analytics?
For a company like Shell, the strategic importance of recognizing as early as possible which groundbreaking ideas have potential cannot be overstated. Energy firms are among the world’s largest companies; Shell’s 2018 revenues were about €347 billion—about three times those of Alphabet or roughly equal to the GDP of Denmark. Constant innovation is critical to Shell’s ability to remain an industry leader.
In 2013, Dutch business innovator Hans Haringa heard about a promising Silicon Valley data startup called Knack offering a new type of service—one that Haringa believed could make his work much more efficient. Haringa worked for Shell and led the firm’s GameChanger team, whose mission was to find people in the organization with groundbreaking, innovative ideas. Haringa and his team spoke with these brilliant, promising potential innovators and tracked their development closely to determine their capacity to bring ideas to fruition and translate them into successful new products and processes. This was a long, difficult journey that usually took Haringa and his colleagues about two years to complete. In the end, about 10% of these promising innovators succeeded in making truly groundbreaking contributions to Shell’s business—meaning that the GameChanger team was spending the vast majority of its time tracking candidates who would not succeed in the end.
The example of Shell demonstrates how data-driven HR can work in practice. Personnel-related data is collected and combined with data about successful innovations. Statistical analyses are then carried out on this combined data set to derive insights into the likelihood that specific human characteristics will lead to outstanding performance. The Dungeon Scrawl and Wasabi Waiter video games are computer programs that make it possible to collect, examine, and implement personnel-related data—also called employee intelligence.
Chapter 1 describes the development of the concept of data analysis since the 1980s; the steady growth in applying data analysis to improve HR instruments and processes since 2005; and the opportunities that big data and modern communications technologies present.
- Chapter 2 Why use HR analytics?
Chapter 2 addresses the question of why HR should make use of analytics and data-driven decision-making. This chapter goes deeper into the shortcomings and disadvantages of traditional decision-making methods, which are primarily based on knowledge, experience, and personal judgement. Among other topics, we call attention to new insights from psychology that shed light upon the (irrational) manner in which people weigh options and make choices.
Laurie Bassi answers this question with another question: why wouldn’t HR use HR analytics? HR analytics is an opportunity to make HR initiatives, policy, and strategy more effective. In Bassi’s reasoning, HR needs to make good arguments about why it would not use HR analytics. The question then becomes to what extent and at what level HR should apply the methodology. In practice, each organization’s HR function will view this quite differently. A data specialist like Google wants to set the tone for every aspect of data use—including where it touches the HR function.
The most important benefits of HR analytics are that it:
1. Directly contributes to meeting the organization’s goals.
2. Saves time and money and accelerates processes.
3. Makes reliable predictions.
4. Delivers more accurate insights into internal organizational processes.
5. Increases the reliability of decisions.
- Chapter 3 HR analytics as part of a continuous organizational process
The introduction of the iPhone in 2007 heralded radical change in the telecom sector. To satisfy ever more demanding customers, mobile operators had to devise a broad spectrum of completely new services. For example, Vodafone Nederland turned its attention to mobile payments and specialized services such as networks of sensors in trash bins that send an alert when they’re full so a garbage truck can come to empty them. In order to develop and offer such services, operators needed employees who could collaborate with third parties—internal advisers whose business administration, technology, or economics backgrounds enabled them to proactively identify and respond to trends. As its HR director at the time noted, Vodafone Nederland had to “continuously be able to find the right people with the right knowledge and skills not only for today’s needs, but those of the near future, because the organization needs to be able to keep up with rapid change.
This shows how rapid technological change continuously influences organizational strategy and requires management to adapt HR planning to keep up. This permanent organizational process and the role that HR analytics can play in it is the central topic of this chapter.
Chapter 3 goes into more detail about how to make HR measurable, including measurement methods that have been developed since the 1960s, and what possibilities data analysis and predictive models add to this. This chapter treats HR analytics as a part of business intelligence. It also introduces the data-driven HR policy life cycle, which has eight phases and includes HR analytics.
Part II - Methodology
- Chapter 4 Determine the business question
Shortly after Irma Doze began working as an analyst for TomTom, she received an email from her managing director. The managing director wanted answers to 15 questions about TomTom’s GPS navigation devices, including “How many devices of each screen size are sold in the market?”, “What are the price differences between comparable competing devices?”, “What are the relative advantages of larger and smaller screens?”, and “What are our customers asking about device screens?” All of these questions concerned the device screen, asked from different perspectives—but there was no clear common thread. They all related to a single business question—but what was that question?
By posing directed questions to her managing director, Irma discovered that the underlying business question was “What price should we charge for our new product?” Once it was clear what the real business question was, Irma had to ask a further ten analysis questions in order to get a useful answer. There was another reason that it made sense for the managing director to make clear what the business question was: she no longer needed to plow through a 200-page report with the answers to all of the analysis questions just to get the answer to the business question. Instead, two pages of conclusions and recommendations were more than sufficient.
An analysis project often originates in management’s desire to tackle a problem or seize an opportunity. Before the analysis can truly begin, the question posed by a HR or line manager needs to be translated into one or more analysis problems. Consequently, an analysis project begins with two steps: determining the business question and translating that question into one or more analysis problems. This chapter focuses on determining the business question.
- Chapter 5 Translate the business question into analytics problems
This chapter focuses on how you can convert a business question (such as the need to pay more attention to talent management) into an analytics problem by first formulating a series of analysis questions. Analysis questions are essential to answering business questions. Because the number of analysis questions that stem from a given business question can be quite large, it’s often impossible to answer all analysis questions in one go. In that case, you have to limit the scope of the analysis. That is to say: what will you analyze and what won’t you analyze?
You should make this choice depending on what is feasible in the context of your project, such as the available budget, knowledge, and capacity. On that basis, select the necessary data sources and the kind of analysis you have to perform. This chapter focuses on defining analytics problems, which includes formulating analysis questions, creating an issue tree, defining the intended output, and defining the constraints.
- Chapter 6 Collect data
Now that we have described the analytics problem, the next step is searching for and using the right data sources. The HR analyst makes an inventory of all sources that could possibly help to answer the analysis question by providing information about possible causes from the issue tree. It’s important to be critical and selective when choosing sources, deciding what order to apply them in, and evaluating their quality and reliability.
One contributing factor here is the fact that the number of available sources has skyrocketed in the past few years. In a growing number of cases, the usual data sources can be augmented with big data to conduct the analysis. If there is a lack of existing data, primary research can serve as a way to collect the necessary data. This chapter describes the opportunities available to HR analysts and the usefulness of big data to HR analytics.
- Chapter 7 Prepare the data
Chapter 6 discussed the various sources from which you can collect data. In many cases, you can’t simply use this data in analyses or reports—you have to first clean it and enrich it. This is true for both primary and secondary data. Data files must also be coupled and new variables derived and calculated from existing data. That is the topic of this chapter.
Before you get to work with data, you must first consider how you will manage this data in the future. This is useful even if you’re just doing a one-time analysis, but it’s an absolute requirement if you’re going to use the same data in different analyses or report on it periodically, such as when you use the data to measure key performance indicators (KPIs). In that case, you have to store the data intelligently and process it well. Only then will the data be easily accessible and usable to repeat prior analyses, perform new analyses, or adapt existing analyses.
Data management is the general term for the management and processing of data for purposes of storage, analysis, and reporting. Data processing as a component of data management is called data preparation.
Data preparation consists of:
• Cleaning the data
• Merging the data
• Enriching the data with extra information
• Deriving and calculating new variables
- Chapter 8 Analyze the data
After you have finished preparing the data and have clean, usable data, you’re ready for the real analysis. The ultimate goal of the analysis is to generate usable, actionable insights. The analytical methods that can be applied can be divided into four categories, beginning with descriptive analytics and ending with prescriptive analytics. The latter dictates what the most appropriate decision in a given situation is.
The first step in any analysis is to describe the data with simple analyses that summarize what has occurred in the given context (e.g., the organization, a process, the market) and what is occurring at the moment. This descriptive step reveals trends and patterns in the data, which helps you to become familiar with and understand the data.
The second step is to look for relationships (correlations and other relationships) in the data. This is also done using relatively simple analyses, such as data filtering and simple correlation and regression analyses. This helps to discover patterns and relationships between variables in the data and build a conceptual model that describes how the variables influence each other. Once you have developed this conceptual model, you are ready for the third step: making predictions.
The third step uses somewhat more complex analytical methods to estimate what could happen in the future. Predictive analytics also includes using available data to make estimates about data you don’t have. A good example of this is the sentiment score that rates email traffic between employees. The text of emails forms the input of this model; its output is a sentiment score between –1 and +1. Even though we can’t measure sentiment directly, we can model it by using a construct that allows us to predict it.
The fourth step in the analysis, as Gartner’s model shows, consists of prescriptive analytics. Prescriptive analytics is a special type of predictive analytics that allows you to propose potential actions and analyze their likely consequences. This analysis allows you to simulate and optimize, showing the possible consequences of a given choice and recommending the best course of action to achieve the desired result.
In this chapter, we describe step by step how HR analysts can put these various analyses into practice.
- Chapter 9 Report and visualize the results and make recommendations
The last step of an analysis project is to report and present the results and conclusions obtained so they will be accepted. After all, you’re only correct if others think you are. Like any other HR professional, HR analysts play the role of advisors. They are in the position to exercise influence—on an individual, a group, or an organization—but not to implement changes. A good report is the crown jewel of an analyst’s work—as long as it communicates a clear, persuasive message. Only then can HR managers, line managers, directors, and the like easily process the insights and put them straight to use.
The outcomes of the analyses should answer and support the business question. HR analysts should think carefully about how they will arrange and present the results and conclusions of the research.
When developing arguments or presenting results, it’s often smart to use data visualizations. Ninety-three percent of human communication is nonverbal. It appears that people pay more attention to, and have more trust in, the human voice and visual cues than the content of a message.
We don’t mean to say that you should simply create as many graphics as possible and just add some comments. The creation of a chart or table only makes sense if it supports the story—and if the data visualization is good. Clever, well-thought-out charts and tables help to communicate ideas faster and more clearly. Only then can a picture really say more than a thousand words. If it doesn’t, it’s more likely to just cause confusion.
All in all, reporting and presentation are very important for an analytics project. Only once the insights have been accepted can they be translated into HR policy, initiatives, or specific decisions and only then is implementation possible.
As noted ,HR analysts also have the role of advisor; this is true for just about every member of HR staff. A structured, persuasive report or a presentation with clear visualizations is a prerequisite to ensuring that conclusions, insights, and ideas are accepted within the organization. But when the HR analysts or HR professionals who get to work on the report do not also have the skills to influence the right people, their recommendations may not be followed up on.
- Chapter 10 Translate insights into HR policy and implement it
Once the HR analyst and the relevant HR manager have presented the results and recommendations and gotten feedback on them, management has to decide whether they can be translated into specific decisions, HR policy, processes, interventions, etc. The more effective this process is, the more the insights will contribute to the development, welfare, and performance of employees in the organization. Chapter 9 presented a sample report that recommended expanding sales capacity and making several organizational changes.
This chapter discusses the opportunities that HR has to establish and implement the actions that follow from these recommendations. That is, the tasks and responsibilities HR can derive from the insights, the perspective from which HR can interpret them, and the role that various stakeholders in the organization have in the process.
Translating insights into HR policy is a core task of the HR function. Human resource management (HRM) can be described as “the entirety of goal-oriented and systematic initiatives, activities, and instruments that contribute to the optimization of an organization’s workforce so that employees make the maximum contribution to the financial and other results and goals of the organization.”
In order to carry out the associated tasks effectively, the role of HR in the organization must be clear.
The changing role of HR managers aside, the task of leading the organization and its workforce is not just the domain of HR. Others, including executives, managers, line managers, employees, worker’s councils, and other stakeholders such as finance, supervisors, government entities, and unions emphatically have their own roles, tasks, and responsibilities.
- Chapter 11 Measure and monitor the results
Every organization keeps tabs on the progress of its activities—or should be doing so—to ensure that they will be performed according to plan and to understand what results have been achieved. This includes the last step of the HR analytics process: assessing whether the changes implemented as the result of an analysis or adjustments made to a predictive model actually produced the intended effects. In order to ascertain this, metrics in general and key performance indicators (KPIs) in particular are essential tools. KPIs help to measure the success of a program, project, or policy.
This chapter focuses on measuring and monitoring the effects of 1) individual analytics projects and 2) the entirety of the HR policy, HR initiatives, and HR processes within the organization. We discuss which types of performance indicators lend themselves best to making good measurements of the intended effects and how to best define them. Finally, we discuss how to visualize the observed results clearly and persuasively in reports and dashboards.
Monitoring is not just the last step in the data-driven policy life cycle; in many cases it’s also the first step. This is because the observed trends in general business or HR-specific performance indicators can motivate the formulation of a new business question.
Part III - Implementation
- Chapter 12 Organizing and implementing the HR analytics process
In a 2017 AnalitiQs survey in the Netherlands, 94% of HR managers said that the use of HR analytics is somewhat important to very important—up from 91% in 2016, 90% in 2015, and 88% in 2014.
As Jorrit van der Togt, Shell’s executive VP of HR strategy and internal communication, said in an interview: “I see the creation of a corporate analytics team in the next ten to 15 years. Departments like finance, IT, marketing, and communication will all apply data analysis. The corporate analytics team will serve all of these disciplines with pure data analytics expertise, or each discipline will develop this specialization internally. In this context, HR analytics will be a game-changer in the long term, as it will become the basis of evidence-based HRM.”
This chapter describes the process of establishing and configuring effective functionality for HR analytics. We describe what competencies, expertise, and IT support are needed. That depends on a number of factors, such as the kind of business questions the organization has; the organization’s size and complexity; the available IT systems, knowledge, and facilities for business intelligence; and the ambitions of management—not to mention the ambitions of HR itself.
HR analytics is a way of thinking and working that employs a methodology and a set of tools and techniques ranging from the relatively simple to the very complex. To materially improve decision-making using HR analytics, management can take one of two paths: either do as much as possible with internal resources or go the outsourcing route and hire outside experts to perform some or all of the process. In any case, the processes and systems needed for this are best built up step by step.
- Chapter 13 Privacy: using personal data for HR analytics
In December 2017, the Netherlands’ Data Protection Authority forced the American company Airbnb to stop processing Dutch social security numbers (SSNs). Airbnb deleted all of the SSNs it had collected and now automatically removes SSNs from all digital copies of identity documents it receives. Privacy law stipulates that nongovernmental organizations can only process SSNs if there is a legal basis for doing so. The SSN is a unique personal identifier and qualifies as protected personal data, as it can easily be used for malicious purposes such as identity fraud. The processing of personal data is governed by the strict rules of the General Data Protection Regulation (GDPR), which went into force throughout the EU on May 25, 2018.
The attention to privacy and the protection of personal data didn’t happen overnight; it’s been on the upswing ever since the rise of the PC and automated data storage. Today, it can no longer be ignored. The rapid pace of technology development has exponentially increased the risks of unauthorized use of personal data. This has received worldwide attention in politics and the media in recent years, in part due to negative publicity surrounding large companies that process personal data.
It’s important for anyone who wants to engage in HR analytics to be conscious of the fact that it’s a sensitive topic both inside and outside of the organization. To avoid unpleasant surprises, it’s also essential to know what the privacy laws in various jurisdictions stipulate. This chapter describes the rules around privacy—in particular as they apply under the jurisdiction of the EU—and the ethical norms that can apply to HR analytics.
- Chapter 14 Getting to work with HR analytics
Now that we’ve reached the final chapter, it’s time to really and truly begin with HR analytics for organizations that haven’t already done so. If the right measures have been taken to protect the privacy of all involved parties, that no longer constitutes an obstacle. This chapter briefly describes a number of potential pitfalls and specific things to look out for and concludes with a checklist and a development framework to ascertain where the organization is currently. With this in hand, you can make an inventory of the desired actions you can already take to begin preparing for your first HR analytics project.
To get started with HR analytics, the first practical step is to determine the maturity level of the organization. On this basis, you can determine what will be required to attain your ideal level—the level at which HR and management both want to use HR analytics. To do this, we have assembled a questionnaire that you can fill out and from which you can derive a list of actions. You can fill in this questionnaire online—which we will reward you for doing by sending the summarized results and a benchmark—please follow the link.
Titel dia
Schrijf uw onderschrift hierKnop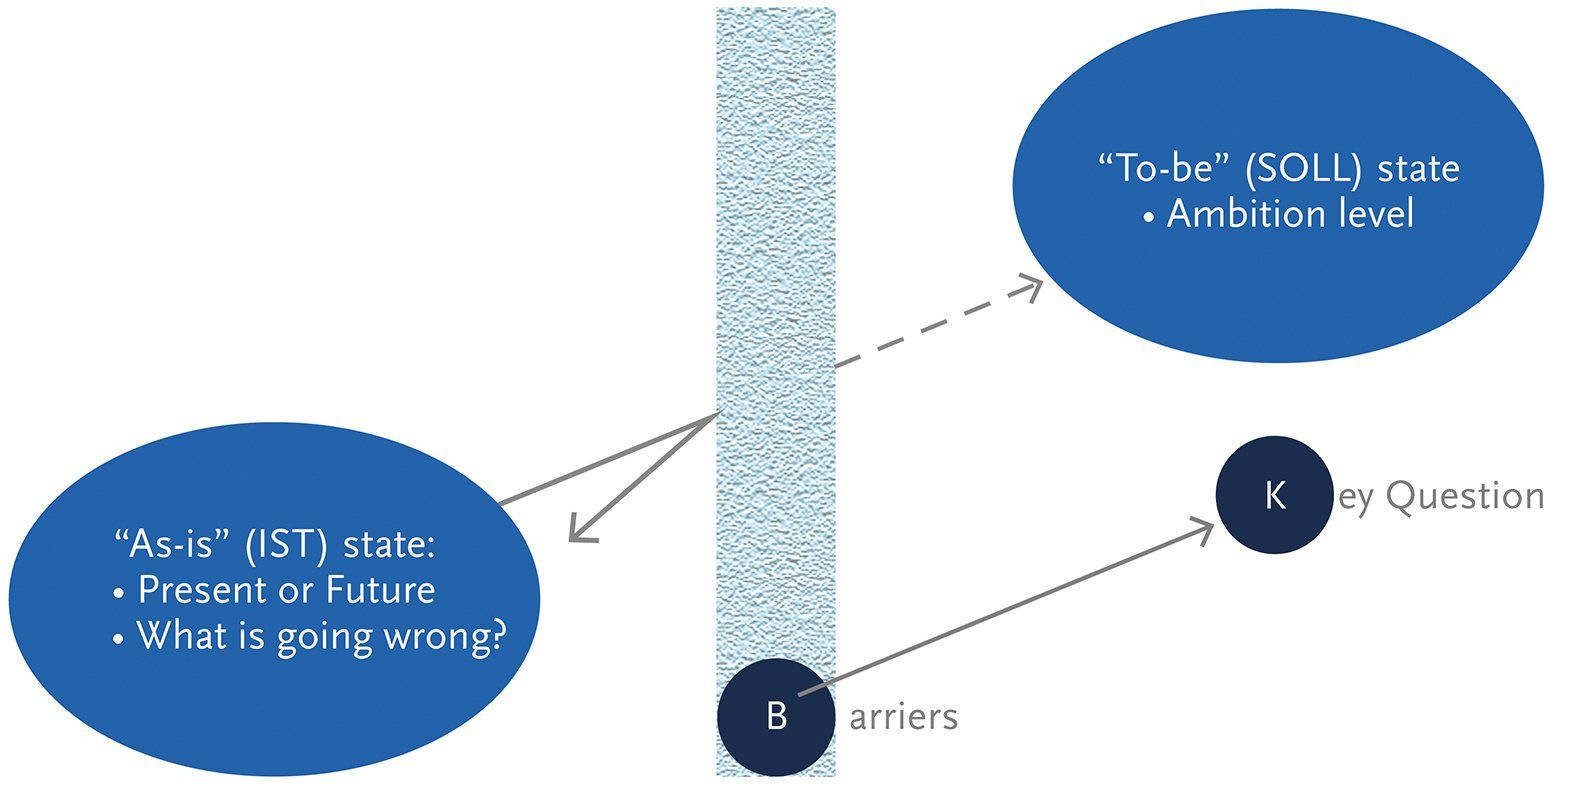
Titel dia
Schrijf uw onderschrift hierKnop
Titel dia
Schrijf uw onderschrift hierKnop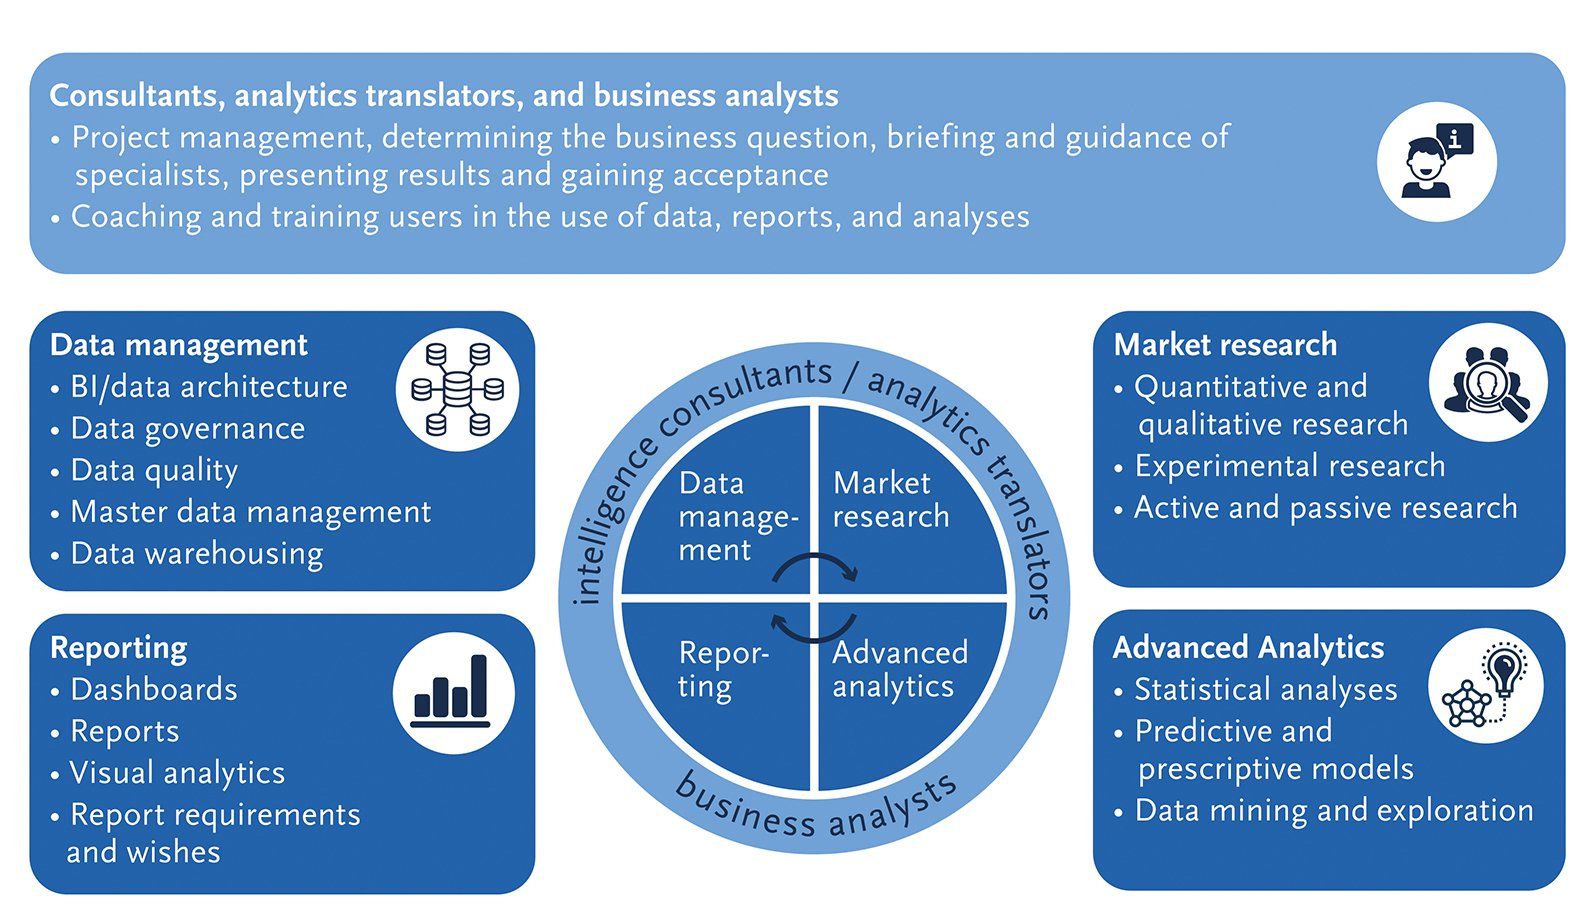
Titel dia
Schrijf uw onderschrift hierKnop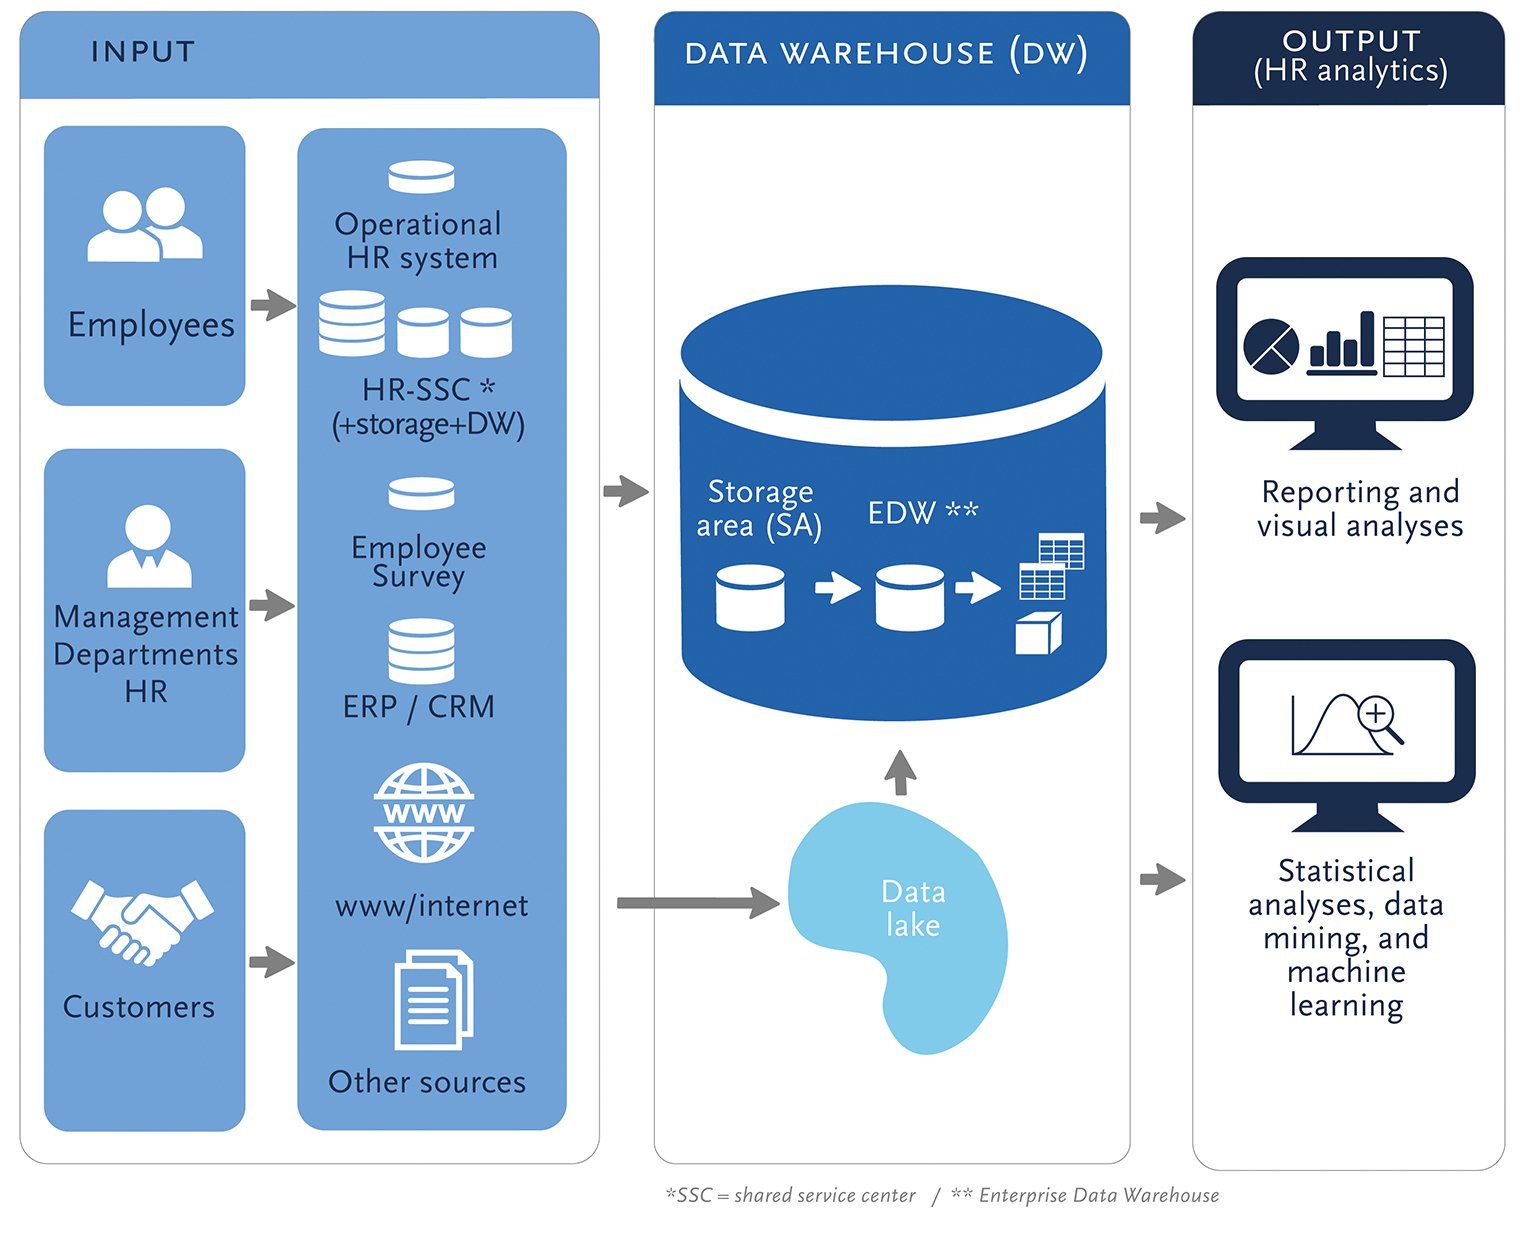
Titel dia
Schrijf uw onderschrift hierKnop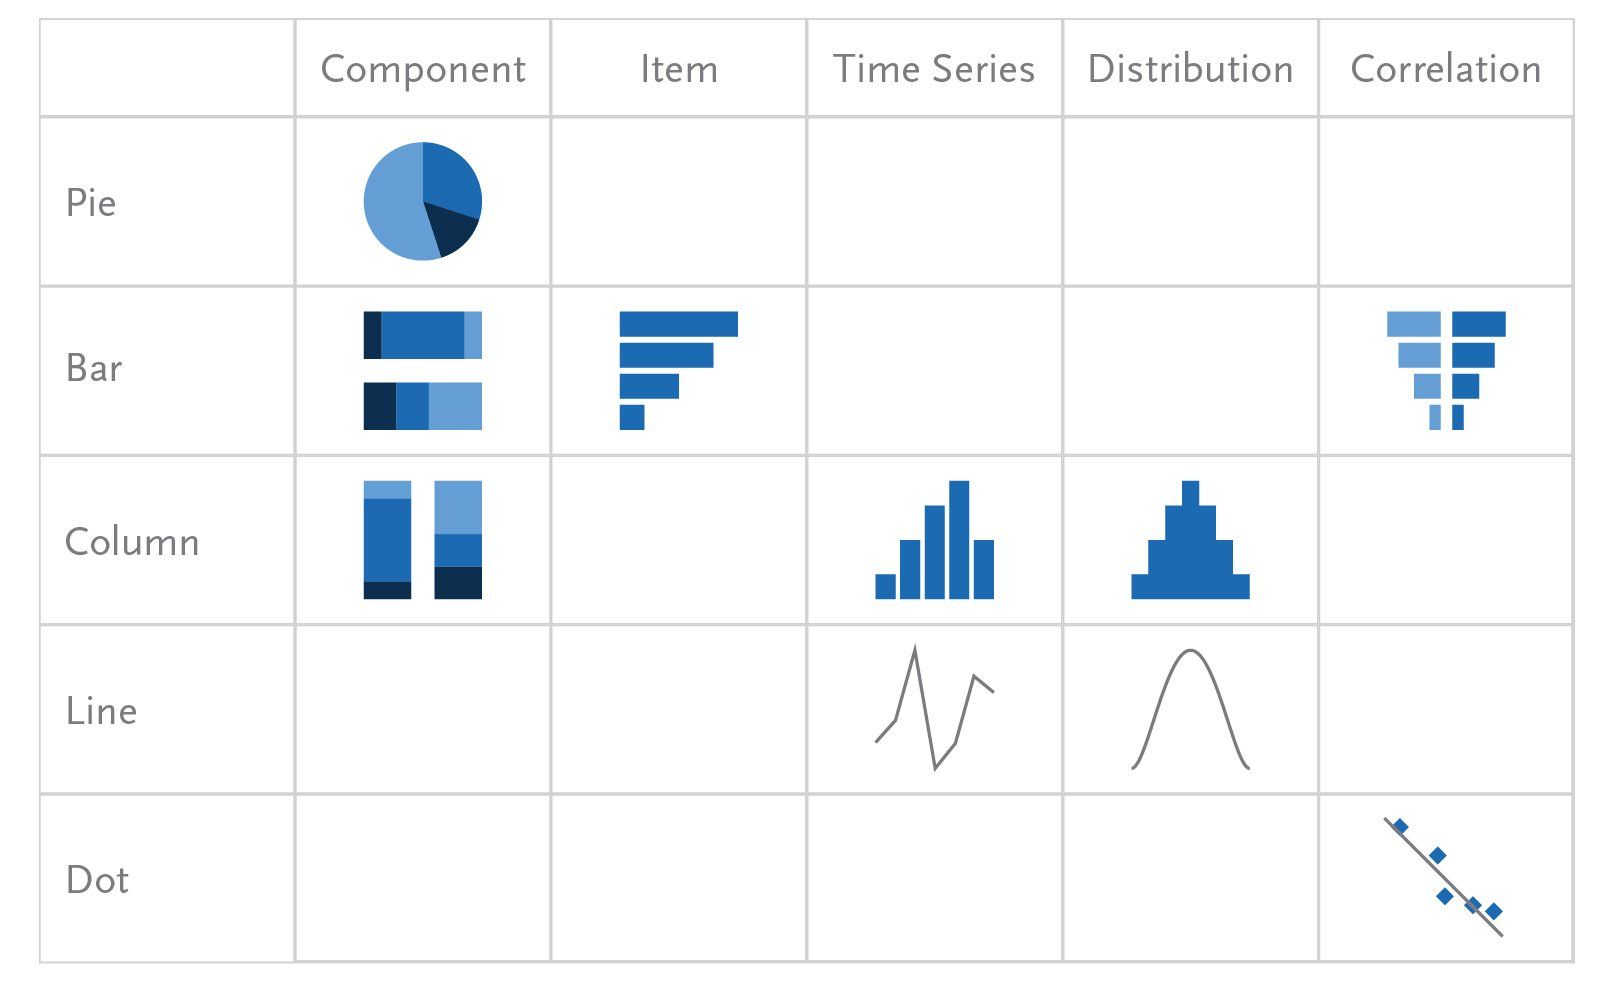
Titel dia
Schrijf uw onderschrift hierKnop